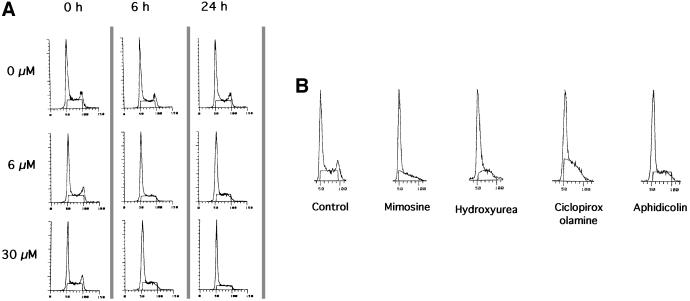
Fig. 1. Arrest of cell cycle progression by replication inhibitors, measured by flow cytometry analysis. The cell cycle phases are determined by the DNA content measured by flow cytometry [5-bromo-2-deoxyuridine (BrdU) incorporation being inhibited by the drug]. (A) Effect of different times of contact with two different concentrations of aphidicolin. The aphidicolin concentrations are indicated on the left and the different times of contact are indicated at the top of the figure. (B) Cell cycle distribution after 24 h of treatment with the different drugs. Concentrations were: 200 µM mimosine; 1 mM hydroxyurea; 20 µM ciclopirox olamine; 6 µM aphidicolin.

An official website of the United States government
Here's how you know
Official websites use .gov
A
.gov website belongs to an official
government organization in the United States.
Secure .gov websites use HTTPS
A lock (
) or https:// means you've safely
connected to the .gov website. Share sensitive
information only on official, secure websites.
