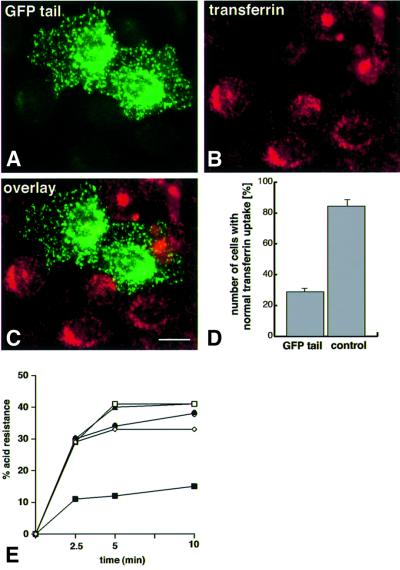
Fig. 8. Over-expression of the whole myosin VI tail causes a marked reduction in clathrin-mediated transferrin uptake. (A–C) Immuno fluorescence of transferrin uptake [red, (B)] in transiently transfected NRK cells expressing GFP–tail (see Figure 1) [green, (A)]; (C) overlay. The effect of the tail in transiently transfected cells on transferrin uptake is shown in the bar graph (D). This quantitation is based on cells showing a reduction in transferrin uptake by >50% compared with untransfected control cells in four different experiments ± SD. In each experiment, at least 100 transfected and 100 non-transfected cells as a control were counted. To measure quantitatively transferrin uptake, stable NRK cell lines expressing myosin VI GFP–tail or GFP alone were used (see Figure 3). The effect of the tail on transferrin uptake is shown by the graph (E); open squares show untransfected cells; open diamonds show cells stably transfected with GFP alone; filled circles show cells stably transfected with myosin VI; filled triangles show cells stably transfected with the GT without the large insert and filled squares show a representative stable transfected cell line overexpressing GFP–myosin VI tail containing the large insert. Data show a representative experiment. Bar: 25 µm.

An official website of the United States government
Here's how you know
Official websites use .gov
A
.gov website belongs to an official
government organization in the United States.
Secure .gov websites use HTTPS
A lock (
) or https:// means you've safely
connected to the .gov website. Share sensitive
information only on official, secure websites.
