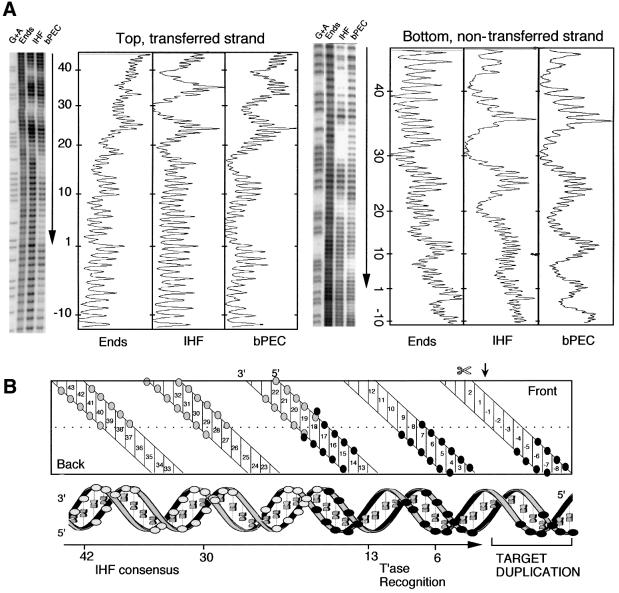
Fig. 2. Hydroxyl radical footprint analysis of the bPEC. (A) Footprints and profiles. The relative intensities of the bands are plotted to the right of each gel. The position of the transposon end and the direction in which it is facing are indicated by the vertical arrows. Nucleotide positions are indicated; +1 is defined as the terminal nucleotide of IS10; –1 is the first nucleotide in the flanking DNA. The transferred strand has a 3′-hydroxyl group at the end of the transposon and is transferred to the target site during transposition. The non-transferred strand is the opposite strand. The sequencing gel and footprint profiles for the non-transferred strand have been inverted for clarity. G + A, Maxam–Gilbert sequence ladder; Ends, free DNA fragment; IHF, IHF-bound end fragment; bPEC, bottom paired ends complex. (B) Summary of protein–DNA contacts. The double helix is represented in two dimensions (top) and three dimensions (bottom). White circles indicate IHF contacts and black circles transposase contacts. The site of first strand cleavage by transposase is indicated by a small vertical arrow and  .
.

An official website of the United States government
Here's how you know
Official websites use .gov
A
.gov website belongs to an official
government organization in the United States.
Secure .gov websites use HTTPS
A lock (
) or https:// means you've safely
connected to the .gov website. Share sensitive
information only on official, secure websites.
