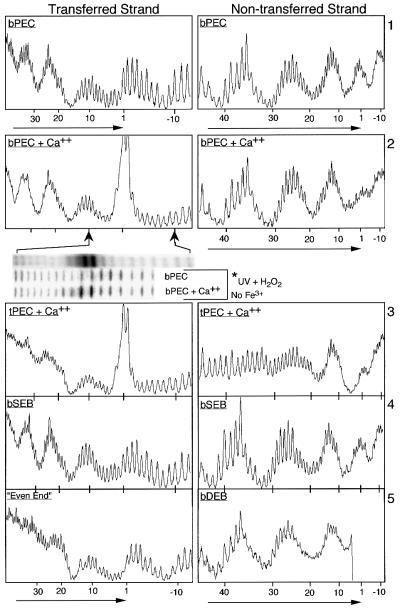
Fig. 4. Hydroxyl radical footprints of transposition intermediates. Nucleotide positions are as defined in Figure 2. The location and direction of the transposon end is indicated by horizontal arrows. The first insert below panel 2 shows an image of the actual gel from which the trace is taken. The second and third insert show the same region of the transposon end in an experiment where hydroxyl radicals are generated without the presence of Fe3+. Hyperreactivity is clearly present at bp +1 and –1, although the result is somewhat less spectacular due to the non-specific destruction of the DNA by UV treatment.

An official website of the United States government
Here's how you know
Official websites use .gov
A
.gov website belongs to an official
government organization in the United States.
Secure .gov websites use HTTPS
A lock (
) or https:// means you've safely
connected to the .gov website. Share sensitive
information only on official, secure websites.
