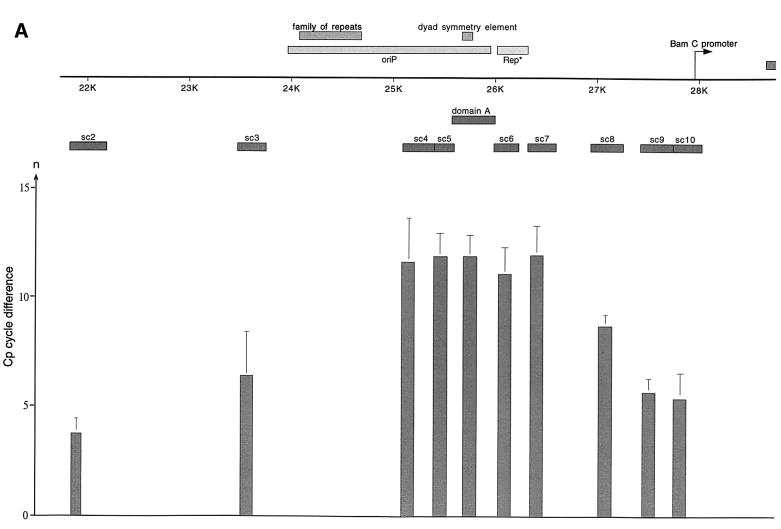
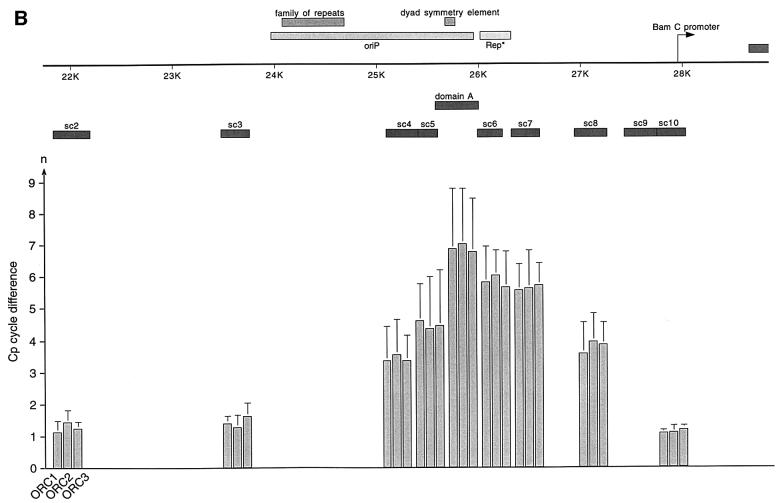
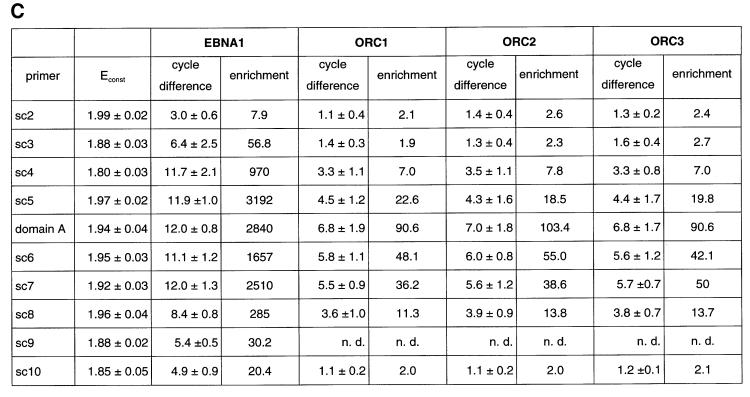
Fig. 4. HsORC binds at the DS element or nearby. (A) Enlarged view of oriP. The locations of the PCR fragments used to scan the binding sites of EBNA1 and hsORC are shown below the ruler (sc2–sc10). The ChIP experiment was performed with cross-linked A39 cells. Immunoprecipitations were executed with the chromatin fraction of 1–2 × 10⁷ cells; 1/100 thereof was used for one PCR. The histogram shows the EBNA1 analysis. The difference between the crossing point of the EBNA1 immunoprecipitate and the isotype control is indicated on the y-axis. The graph shows the mean value and standard deviation of three independent experiments. (B) Histogram of DNA fragments accumulated in immunoprecipitates with polyclonal antibodies directed against the hsORC subunits 1, 2 and 3 (see Figure 2). Therefore, triplets are shown for each scanning PCR fragment to illustrate the data for hsORC1, 2 and 3. The mean values and standard deviations are again calculated from three independent experiments. (C) This table summarizes the data of the histograms and calculates the enrichment of the analysed fragments. Each individual Econst of the primer pairs was determined from standard curves of 10-fold dilutions of the immunoprecipitations, using the formula Econst = 10–1/slope (see Figure 3 for details). The cycle differences are shown as mean values of three independent experiments. The enrichment of each fragment was calculated as explained in Figure 3C using the mean values of Econst, and the difference of the crossing points between the specific immunoprecipitations and the pre-immune/isotype immunoprecipitations.

An official website of the United States government
Here's how you know
Official websites use .gov
A
.gov website belongs to an official
government organization in the United States.
Secure .gov websites use HTTPS
A lock (
) or https:// means you've safely
connected to the .gov website. Share sensitive
information only on official, secure websites.


