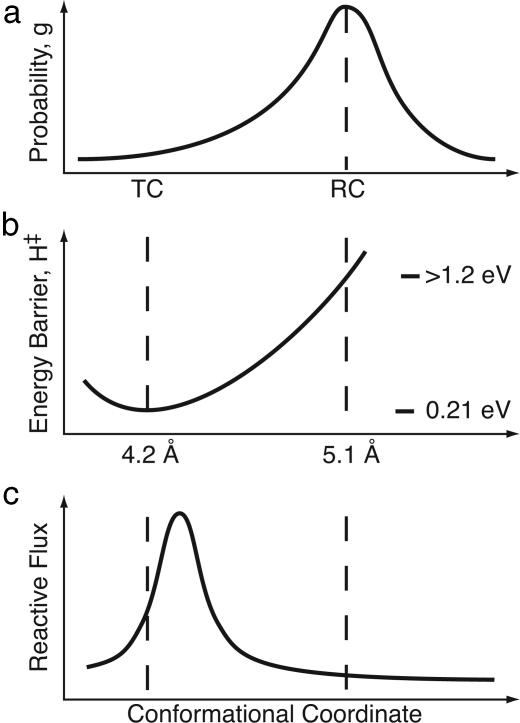
Fig. 4.
Schematic separation of reaction rate into conformational and vibrational (Arrhenius) coordinates. (a) The distribution of protein conformations, with RC representing an average structure and TC a less-populated member of the distribution. (b) We have calculated an enthalpy barrier for two members of the ensemble, and interpolated between in this figure. (c) Reactive flux as a function of conformation, calculated by using the Agmon–Hopfield formalism described in the text. Note that 1 eV per molecule ≈ 100 kJ/mol.

