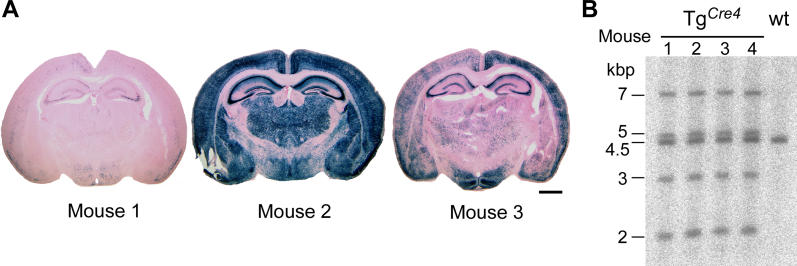
Figure 3. Variability of Cre Expression of Mouse Line TgCre4 .
(A) Variable Cre expression in forebrains of three different mice positive for TgCre4 and R26R Cre indicator (see Figure S1) at postnatal day 12 pictured by the Cre-dependent β-galactosidase activity (blue, X-gal, counterstain by eosin) in coronal brain slices. Scale bar: 1.25 mm.
(B) Southern blot analysis of BglII-digested genomic mouse DNA of four TgCre4 mice that differed in the Cre expression pattern. Southern probe detects the wild-type (4.5 kbp) and the transgenic (7, 5, 3, and 2 kbp) alleles.

