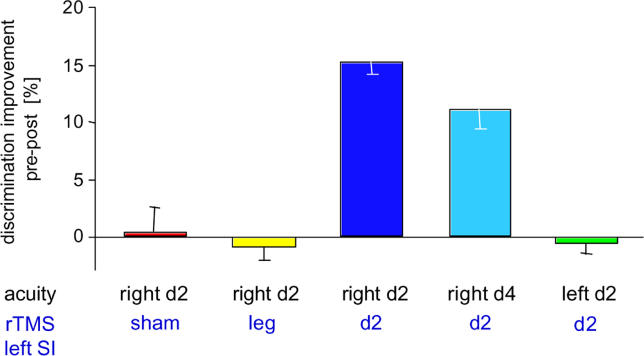
Figure 3. Perceptual Effects Evoked by 5 Hz TMS.
Mean percent changes (± SEM) in discrimination thresholds after rTMS application expressed as post-rTMS relative to pre-rTMS (pre = 100 %). At the bottom, the site of assessment of tactile acuity is given in black, and the site of TMS application is given in blue. Threshold changes are shown for the right index finger after sham rTMS (red); right index finger after rTMS over left representation of right lower leg (yellow); right index finger after rTMS over left representation of right index finger (dark blue); right ring finger after rTMS over left representation of index finger (light blue); and left index finger after rTMS over left representation of right index finger (green).

