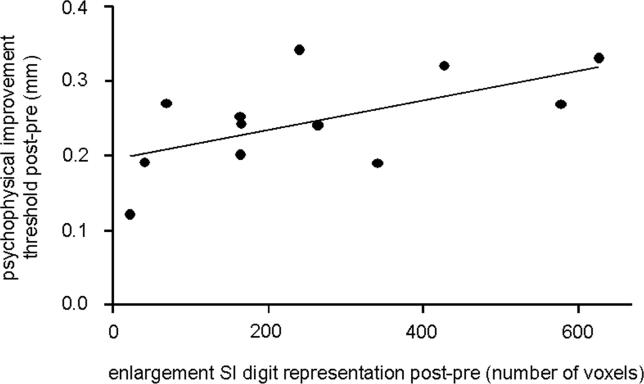
Figure 6. Relation between Perceptual and Cortical rTMS-Evoked Changes.
Linear correlation analysis (Pearson, r = 0.603, p = 0.037) between individual rTMS induced changes in BOLD signals in SI (difference in activated voxels post-pre) and associated changes of two-point discrimination thresholds post-pre.

