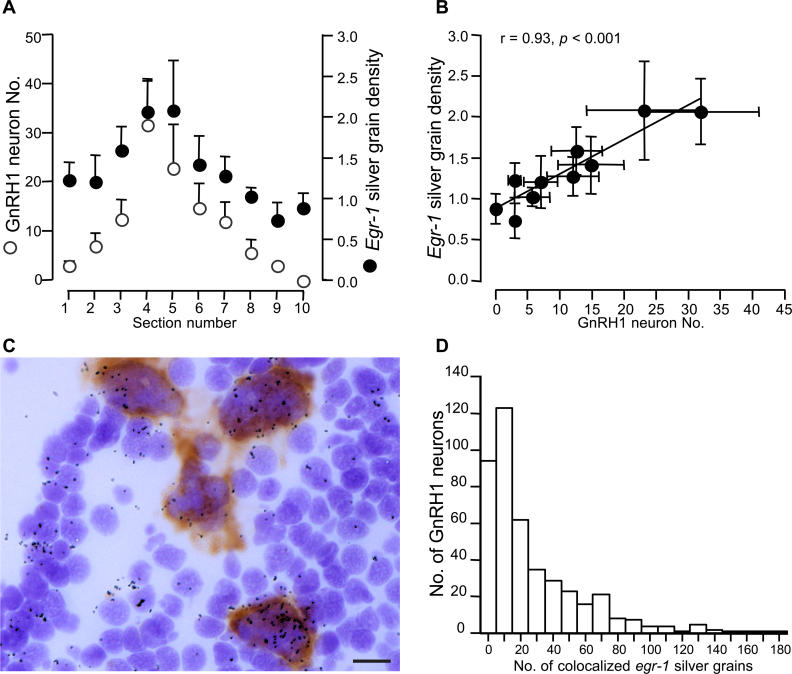
Figure 5. Relationship between egr-1 and GnRH1 in the aPPn.
(A) Mean + SE GnRH1 neuron number (indicated by an open circle) and egr-1 silver grain density (indicated by a closed circle) by section number (rostral to caudal).
(B) Covariation of mean ± SE GnRH1 neuron number and egr-1 silver grain density within sections.
(C) Photomicrograph of egr-1 (silver grains) and GnRH1 (brown precipitate) expressing neurons in the aPPn. Scale bar represents 10 μm.
(D) Histogram showing the number of GnRH1 neurons with the corresponding range of co-localized egr-1 silver grains.

