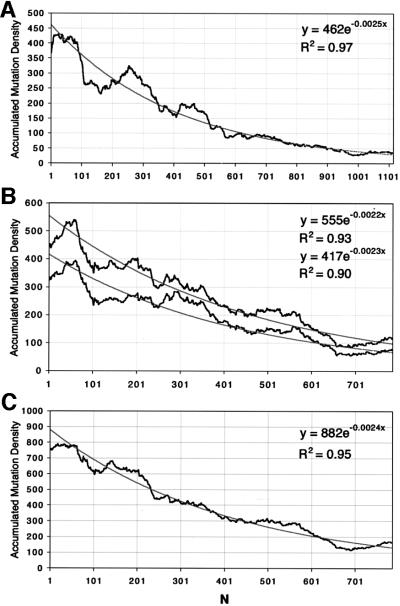
Fig. 3. Accumulated mutation density in 100 bp intervals. Details of how the mutation density is calculated are included in Materials and methods. The black line represents pooled mutation density. The grey lines are fitted curves to the experimental data. The insets show the equations and R2 values for the exponential fits. (A) Pooled light chains. N = 1 corresponds to position 239 from the initiation Met in the Lκ light chain. (B) Top curves correspond to pooled JH2, three and four rearrangements, while the bottom curves are derived from JH2 and JH4 rearrangements. N = 1 corresponds to position 330, 713 and 1284 of JH2, JH3 and JH4, respectively, as in Figure 1A. (C) Pooled mutation density for heavy and light chains. N = 1 corresponds to position 531 of Lκ for the light chains and the same as (B) for heavy chains.

An official website of the United States government
Here's how you know
Official websites use .gov
A
.gov website belongs to an official
government organization in the United States.
Secure .gov websites use HTTPS
A lock (
) or https:// means you've safely
connected to the .gov website. Share sensitive
information only on official, secure websites.
