Fig. 5.

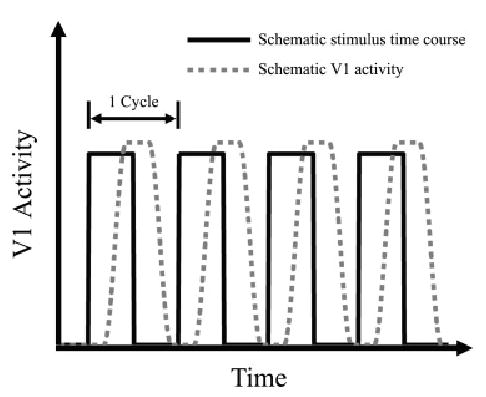
Schematic V1 activity in response to periodic retinal stimulation. The black curve represents the periodic retinal stimulation. The gray dashed curve represents the corresponding schematic V1 activity. Four cycles of activity are depicted.

Schematic V1 activity in response to periodic retinal stimulation. The black curve represents the periodic retinal stimulation. The gray dashed curve represents the corresponding schematic V1 activity. Four cycles of activity are depicted.