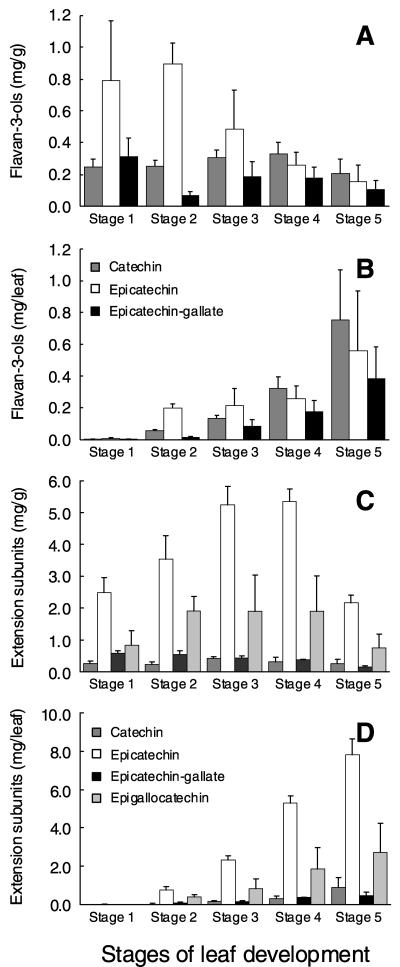
Figure 8.
Composition of PAs in grape leaves during development. A, Flavan-3-ol content as mg/g. B, Flavan-3-ol content as mg per leaf. C, Extension subunits of PAs shown as mg/g. D, Extension subunits of PAs shown as mg per leaf. The stages of leaf development are defined in “Materials and Methods.” All data is presented as mean of three replicates.

