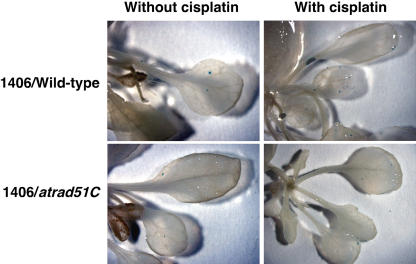
Figure 8.
Frequencies of intrachromosomal HR in atrad51C and wild-type plants. A to F, Frequency distribution histogram shows the proportions of plants with a given number of blue GUS spots in the direct repeat (A, without genotoxic stresses; C, with cisplatin treatment; E, with bleomycin treatment) and inverted repeat (B, without genotoxic stresses; D, with cisplatin treatment; F, with bleomycin treatment) populations. atrad51C mutant and wild-type plants are shown as black and white bars, respectively. Images, Visualization by histochemical staining of recombination events in the direct-repeat line 1406. Top left, Wild-type plant without genotoxic stress; top right, wild-type plant with cisplatin treatment; bottom left, atrad51C plant without genotoxic stress; bottom right D, atrad51C plant with cisplatin treatment.


