
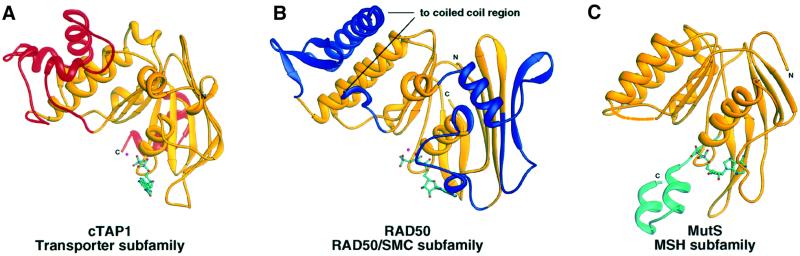
Fig. 4. (A) Ribbon diagram of cTAP1 highlighting in red the regions specific to the transporter subfamily of ABC ATPases, conserved in cTAP1, HisP (1b0u; Hung et al., 1998) and MalK (1g29; Diederichs et al., 2000). (B) Ribbon diagram of RAD50 (1f2u; Hopfner et al., 2000) highlighting in blue the regions structurally specific to the RAD50/SMC type ABC ATPase DNA repair proteins. (C) Ribbon diagram of E.coli MutS (1e3m; Lamers et al., 2000) with the region specific to the MSH subfamily of ABC ATPases colored green.