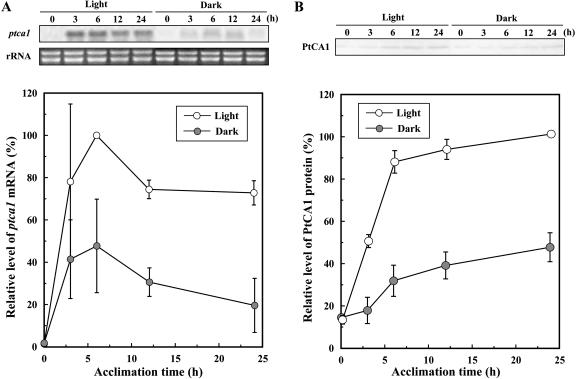
Figure 1.
Time course of accumulations of ptca1 mRNA and protein during acclimation from 5% CO2 to air in the light or dark. A, Top, Northern blots of ptca1 and ethidium bromide staining of rRNA. RNAs were extracted from air-acclimating cells in the light or dark; bottom, relative intensity of densitometry of northern-blot analysis at different times of acclimation. Open and closed circles represent accumulation profiles in the light and dark, respectively. B, Top, Western blots with anti-PtCA1-rabbit antibody (PtCA1). Proteins were extracted from air-acclimating cells in the light or dark; bottom, relative intensity of densitometry of western-blot analysis at several different times of acclimation. Open and closed circles represent accumulation profiles in the light and dark, respectively. Equal amount of total-soluble protein (20 μg) was loaded in each lane. Densities of bands were expressed as relative values (%) of the maximum signal intensity of each analysis. Densitometry data were quantified using NIH image software. Data are shown as mean values ± sd of three independent measurements.

