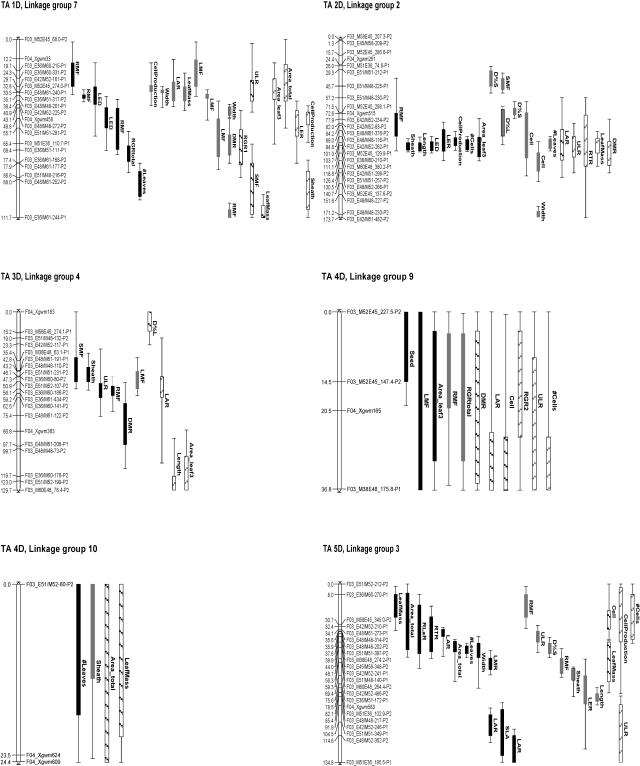
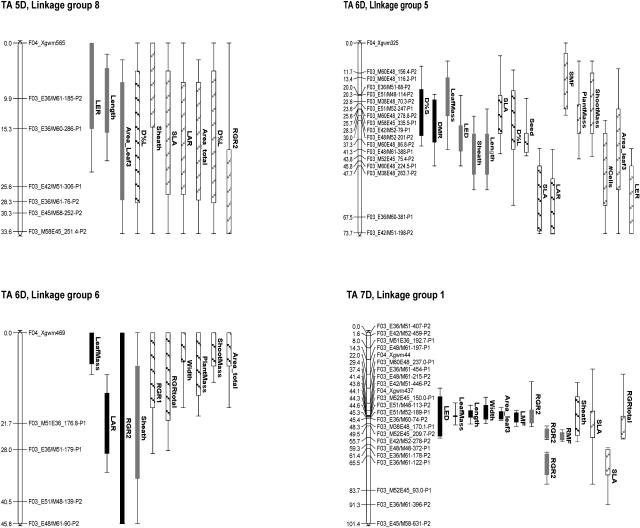
Figure 2.
AFLP linkage map of A. tauschii chromosomes. Positions of QTLs above the LOD threshold of 2.65 are represented by solid bars, and QTLs with 1.5 < LOD < 2.65 by hatched bars. Black and gray bars represent QTLs with positive and negative additive effect, respectively. Bars and whiskers indicate QTL locations with a 1- and 2-LOD support interval, respectively. TA + number refers to the chromosome number in the D genome of T. aestivum. Linkage map drawing was made using MapChart (Voorrips, 2002).


