
Figure 1.
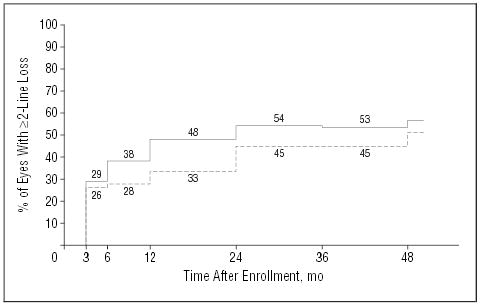
Percentages of patients in each treatment arm who had a visual acuity of the study eye of 2 lines or more (≥8 letters) worse than at baseline by each examination after study enrollment. Based on a model that considers both losses and recoveries of visual acuity (P=.13, χ2 test). Solid line indicates observation arm (n=113 patients); broken line, surgery arm (n=112 patients).