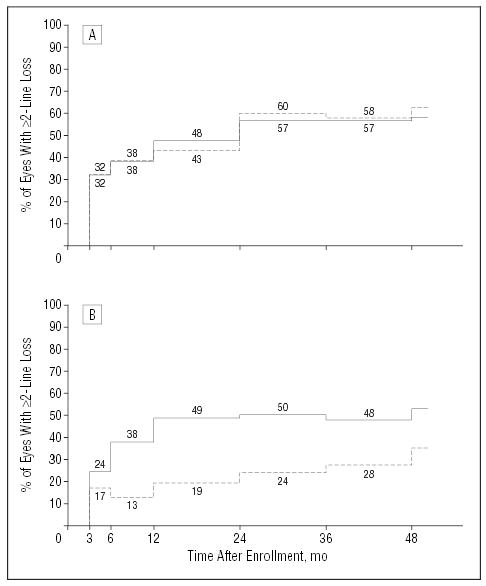
Figure 2.

Percentages of patients in each treatment arm who had a visual acuity of the study eye of 2 lines or more (≥8 letters) worse than at baseline by each examination after study enrollment and by initial visual acuity of the study eye. Based on a model that considers both losses and recoveries of visual acuity. Solid lines indicate observation arm; broken lines, surgery arm. A, Patients whose study eye visual acuity was 20/100 or better (20/50–20/100) at the time of enrollment (68 observation eyes, 65 surgery eyes; P=.56, χ2 test). B, Patients whose study eye visual acuity was worse than 20/100 (≥20/125) at the time of enrollment (45 observation eyes, 47 surgery eyes; P=.003, χ2 test).
