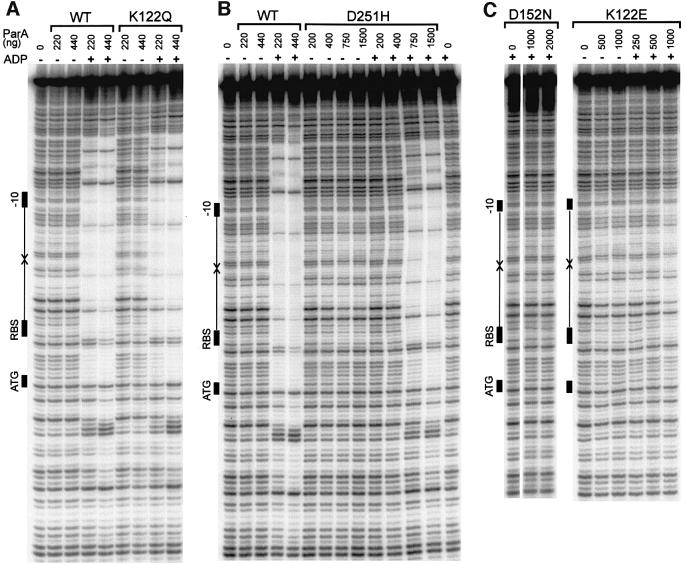
Fig. 5. Site-specific DNA-binding activities of wild-type and mutant ParA proteins. DNA binding to the parOP sequence was measured by DNase I protection assays (Materials and methods). The diagram at the left of each gel shows the elements of the promoter sequence parOP: the arrows represent the inverted repeats that are the recognition sequences for ParA, and the black rectangles show the positions of the –10 promoter signal, the ribosome-binding site (RBS) and the start codon for the parA gene (ATG). (A) DNA binding by wild-type ParA and ParA K122Q. The amount of ParA (in ng) is indicated above each lane. ADP, when present, was at 2 mM. (B) DNA binding by ParA D251H. The experiments were performed as in (A) except that the salt in the buffer was reduced to 25 mM NaCl. The amount of ParA (in ng) in each assay is indicated above each lane. ADP, when present, was at 5 mM. (C) DNA binding of ParA D152N and ParA K122E. The amount of ParA (in ng) in each assay is indicated above each lane. ADP, when present, was at 2 mM.
