
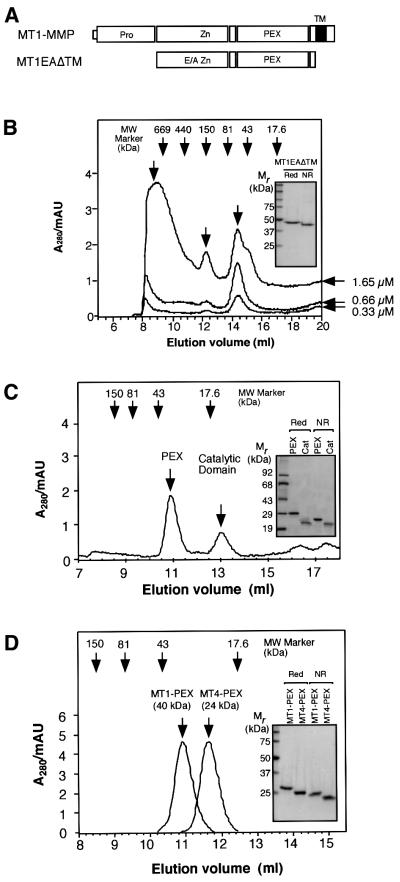
Fig. 2. MT1-MMP directly forms a homophilic complex. (A) A schematic representation of MT1EAΔTM expressed in E.coli. E/A, Glu240 to Ala mutation. (B) Gel filtration analysis of MT1EAΔTM at different concentrations. Three different concentrations of MT1EAΔTM (0.33, 0.66 and 1.65 µM) were subjected to gel-permeation column chromatography on Superdex 200. The inset shows SDS–PAGE analysis of MT1EAΔTM under reducing (Red) and non-reducing (NR) conditions. Bands were visualized by Coomassie Blue. (C) MT1EAΔTM (50 µg/ml) was treated with trypsin (0.1 µg/ml) at 37°C for 1 h to separate the catalytic domain and PEX. Trypsin was inactivated by the addition of 2 mM phenylmethylsulfonyl fluoride to the mixture. The sample was then subjected to gel-permeation column chromatography on Superdex 75. The inset shows the SDS–PAGE analysis of the purified PEX and catalytic domains on the column under reducing and non-reducing conditions; the bands were visualized by Coomassie Blue. (D) Escherichia coli-expressed MT1-MMP PEX and MT4-MMP PEX were subjected to gel-permeation column chromatography on Superdex 75. The inset shows the SDS–PAGE analysis of MT4-MMP PEX under reducing and non-reducing conditions; the bands were visualized by Coomassie Blue.