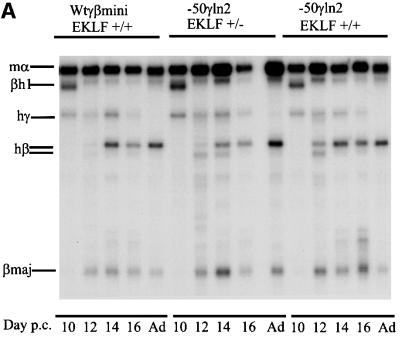
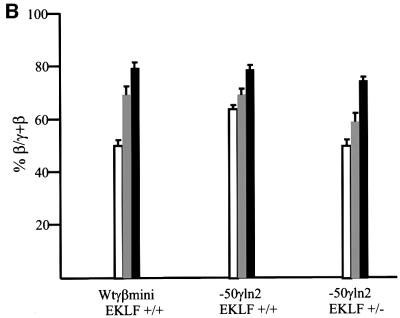
Fig. 3. Expression levels in different EKLF backgrounds. (A) S1 nuclease protection assay. Probes for the human γ- and β-globin and mouse εy and α-globin were as above. Protected fragments are indicated to the left of each panel. All mice analyzed were hemizygous for the wtγβmini and –50γln2 in either the EKLF+/+ or EKLF+/– backgrounds as indicated above each line (p.c., post-conception). (B) Bar diagrams of the expression level (% β/γ + β) of the wtγβmini compared with the –50γln2 in the EKLF+/+ and EKLF+/– backgrounds at 12 (white), 14 (light gray) and 16 (black) days of development.

An official website of the United States government
Here's how you know
Official websites use .gov
A
.gov website belongs to an official
government organization in the United States.
Secure .gov websites use HTTPS
A lock (
) or https:// means you've safely
connected to the .gov website. Share sensitive
information only on official, secure websites.

