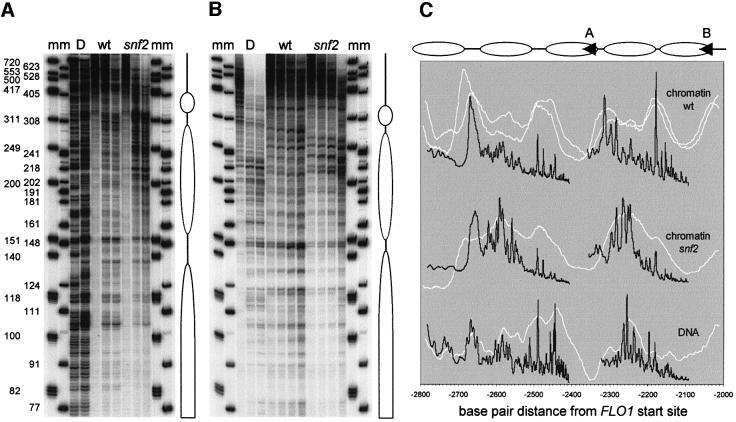
Fig. 7. High resolution analysis confirms remodelling of two nucleosomes in the 2.5 kb region upstream of FLO1. Primer extension mapping of micrococcal nuclease cleavage sites from primers starting at –2339 bp (A) and –2033 bp (B). Markers ‘m’ are a 5′-end-labelled φX174 HinfI digest and a 3′ filled-in pBR322 MspI digest with one nucleotide added. (C) Gel traces of wild-type ‘wt’, ‘snf2’ chromatin and naked DNA ‘D’ digestions as shown in (A) and (B) were plotted (black) on a linear base pair scale relative to the start site of transcription. The gel migration distances in each trace were recalculated to base pairs, using the equation for the DNA standard curve determined by polynomial regression analysis of the bands from the two markers. The corresponding traces from the indirect end-labelling analysis (Figure 6G) were plotted similarly on a linear base pair scale (white). Duplicate ‘wt’ data from independent experiments are shown. Alignment with the high resolution trace was within 10 bp; this was corrected for maximum fit. Also shown are the locations of the primers (arrowheads A and B) used in the extension reactions of gels (A) and (B), and putative nucleosome positions assigned on the basis of the digestion patterns.

An official website of the United States government
Here's how you know
Official websites use .gov
A
.gov website belongs to an official
government organization in the United States.
Secure .gov websites use HTTPS
A lock (
) or https:// means you've safely
connected to the .gov website. Share sensitive
information only on official, secure websites.
