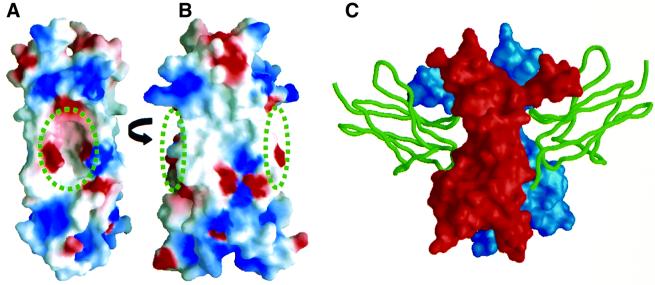
Fig. 6. Comparison of the IL-17F surface and the TrkA-binding site on NGF. (A and B) The molecular surface of IL-17F is oriented as in Figure 5. IL-17F is colored according to the electrostatic surface potential: red, –5 kT; white, 0 kT; and blue, +5 kT. The positions of the cavities are indicated by the circles. (C) The molecular surface of NGF is shown in the same orientation as IL-17F in (B) with the two protomers of the dimer colored red and blue; domain 5 of TrkA is shown as a green ribbon (Wiesmann et al., 1999).

An official website of the United States government
Here's how you know
Official websites use .gov
A
.gov website belongs to an official
government organization in the United States.
Secure .gov websites use HTTPS
A lock (
) or https:// means you've safely
connected to the .gov website. Share sensitive
information only on official, secure websites.
