
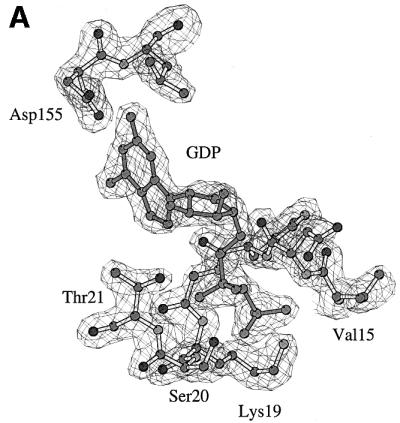


Fig. 2. The GDP-binding site. (A and B) Final omit Fo – Fc electron density maps contoured at 3.0σ superimposed on a stick model of the GDP site. (B) A differently oriented stereo view including water molecules. (C) Schematic representation of the protein–nucleotide interactions.