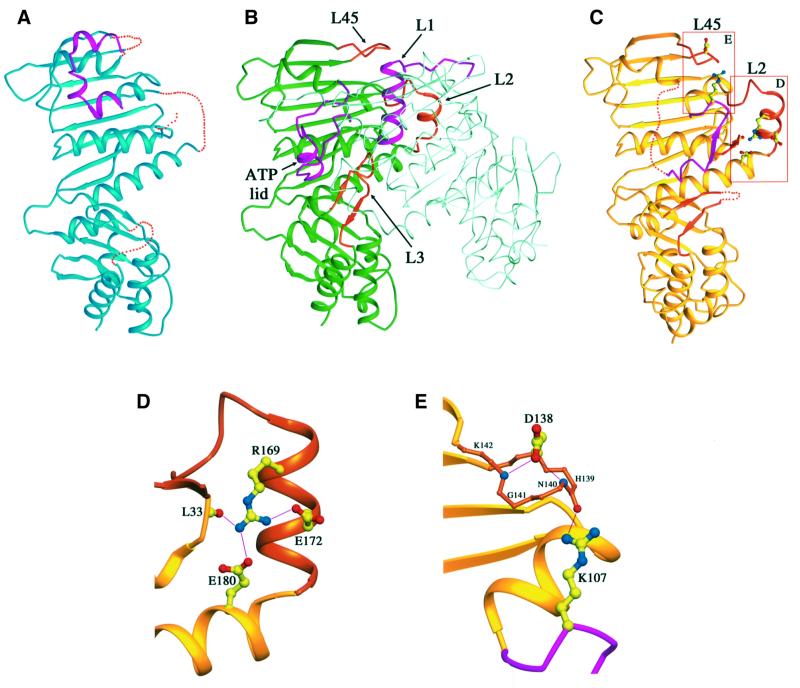
Fig. 3. Comparison of LN40 and NhPMS2 structures. Ribbon diagrams of (A) apo-LN40 in blue, (B) dimeric LN40 in complex with ADPnP, one monomer shown in dark green and the other as a Cα trace in light green, and (C) NhPMS2 in yellow. The ATP lid and L1 loop are shown in magenta, and other loops undergoing structural transformation in orange. Dotted lines represent disordered loops. (D) An enlarged view of L2 of NhPMS2. Side chains of Arg169, Glu172 and Glu180 and main-chain carbonyl group of residue Leu33 are shown as ball-and-sticks. Carbon atoms are shown in yellow, oxygen in red, and nitrogen in blue. Hydrogen bonds are shown as thin lines. (E) An enlarged view of L45. Cα trace of L45 with main-chain nitrogen atoms of residues Asn140 and Lys142 marked as blue spheres. Side chains of Asp138 and Arg107 are central for stabilizing the loop.

An official website of the United States government
Here's how you know
Official websites use .gov
A
.gov website belongs to an official
government organization in the United States.
Secure .gov websites use HTTPS
A lock (
) or https:// means you've safely
connected to the .gov website. Share sensitive
information only on official, secure websites.
