
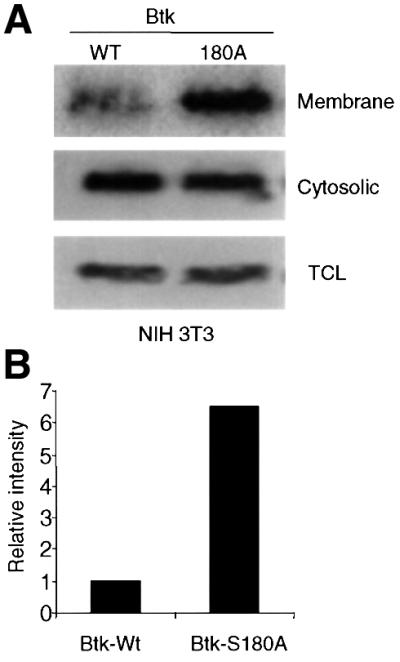
Fig. 6. Increased membrane targeting of Btk-S180A. (A) NIH 3T3 cells expressing Btk-Wt or Btk-S180A were fractionated by hypotonic lysis and Dounce homogenization (Li et al., 1995). Membrane and cytosolic fractions, and total cell lysates were analyzed by immunoblotting with anti-Btk antibody. (B) Graphical representation of Btk membrane localization. Relative intensity of Btk band was analyzed by densitometry. The data shown are representative of two independent experiments.