
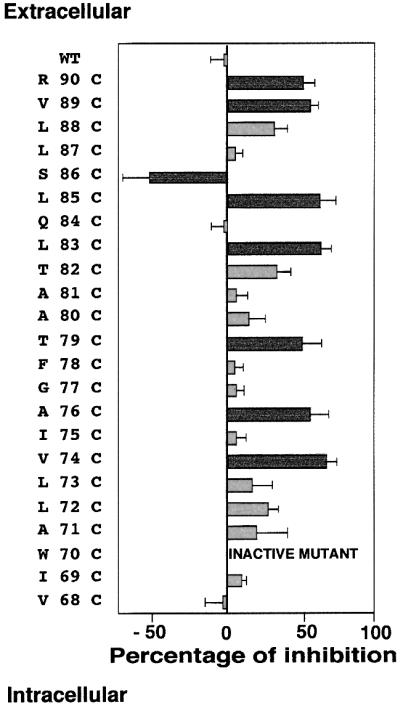
Fig. 3.Histogram summarizing the sensitivities of the cysteine mutants of the FaNaC first transmembrane segment following 3 min of 1 mM MTSET application, and the corresponding SEMs. Experimental procedures were carried out as described in Figure 2and in Materials and methods. Data for each mutant were obtained from at least six independent recordings and the percentages of inhibition calculated as (Imax– I)/Imax, where Imaxis the current amplitude before 3 min of MTS application, and Ithe current amplitude following MTS application. Cysteine mutants at positions 74, 76, 79, 83, 85, 86, 89 and 90 are strongly affected by MTSET (Student’s t-test, p<0.001), and the corresponding histogram bars are represented in dark grey.