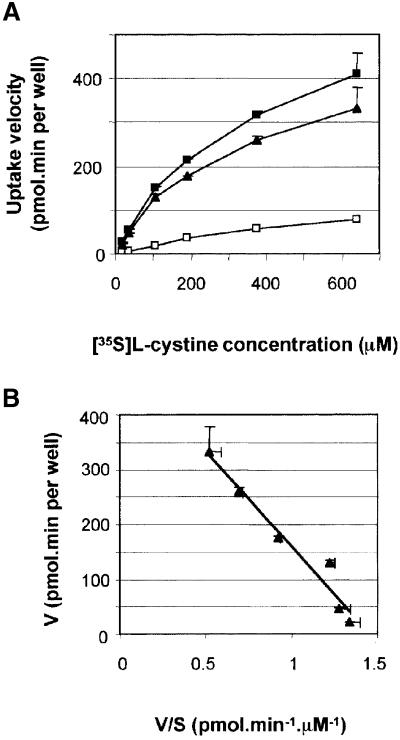
Fig. 4. Saturation kinetics of cystinosin-mediated cystine uptake. (A) Plot of the velocity (V) of [35S]cystine uptake versus increasing substrate concentration (S) for mock-transfected (white squares) and cystinosin-ΔGYDQL-expressing (black squares) cells over an 8 min uptake period (linear phase). A deduction of background levels demonstrates that cystine uptake by cystinosin-ΔGYDQL is saturable (black triangles). (B) A linear Eadie–Hostee plot of the cystinosin-ΔGYDQL-dependent data demonstrates that cystine transport follows Michaelis–Menten kinetics. KM = 350 µM and Vmax = 507 pmol/min per well for this experiment.

An official website of the United States government
Here's how you know
Official websites use .gov
A
.gov website belongs to an official
government organization in the United States.
Secure .gov websites use HTTPS
A lock (
) or https:// means you've safely
connected to the .gov website. Share sensitive
information only on official, secure websites.
