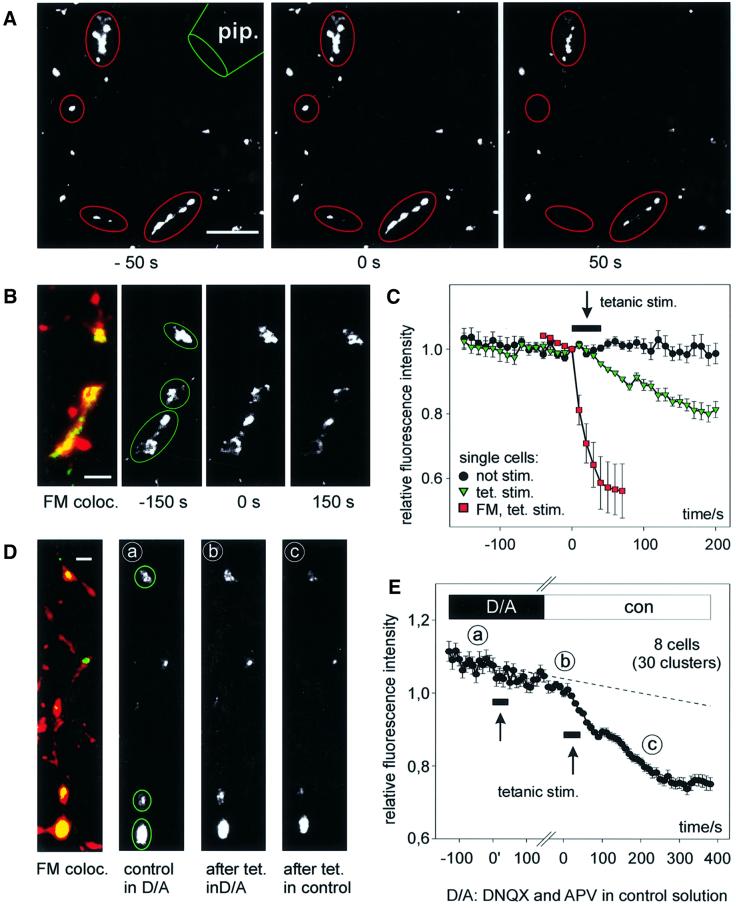
Fig. 5. Synaptic release of BDNF–GFP upon high-frequency synaptic stimulation. (A) Monochrome images (at the time points indicated) from a representative destaining experiment of FM 4-64-labelled presynaptic terminals using extracellular tetanic stimulation [800 pulses in 16 × 1 s bursts (2.5 s intervals) at 50 Hz]. pip., stimulation pipette. (B) Synaptic co-localization of BDNF–GFP clusters with FM 4-64 (left) and monochrome images of BDNF–GFP fluorescence before and after tetanic stimulation [same paradigm as in (A)]. Images in (A) and (B) are from different cells. (C) Average change in fluorescence intensity of the postsynaptic BDNF–GFP clusters marked in (B) (green triangles) versus results of a non-stimulated cell under identical conditions (black circles). Red squares show averaged release of FM 4–64 from the presynaptic terminals marked in (A). The arrow pointing to a black bar indicates the duration of stimulation. (D) Synaptic co-localization (yellow) of BDNF–GFP clusters (green) with FM 4–64 (red) of a cell subjected to two rounds of tetanic stimulation. Monochrome images show BDNF–GFP fluorescence prior to first tetanus in DNQX/APV (a), 250 s after first tetanus in D/A and immediately prior to the second tetanus (b), and 250 s after second tetanus in control (c). Note the stimulus-induced loss of fluorescence only between b and c. (E) Averaged data from eight cells as in (D). The labels a–c indicate time points of images shown in (D). Data are aligned with respect to the two tetani (at 0′ and 0; duration of tetani indicated by arrows pointing to black bars). The gap on the time axis accounts for slightly different intervals between the two tetani in individual cells (210–380 s). The dashed line is extrapolated from photobleaching during 5 min prior to first tetanus. The reversible block of BDNF–GFP release by APV and DNQX reveals that synaptic secretion of BDNF–GFP upon presynaptic tetanic stimulation depends on depolarization via postsynaptic glutamate receptors. Scale bars: 10 µm (A), 3 µm (B and D).

An official website of the United States government
Here's how you know
Official websites use .gov
A
.gov website belongs to an official
government organization in the United States.
Secure .gov websites use HTTPS
A lock (
) or https:// means you've safely
connected to the .gov website. Share sensitive
information only on official, secure websites.
