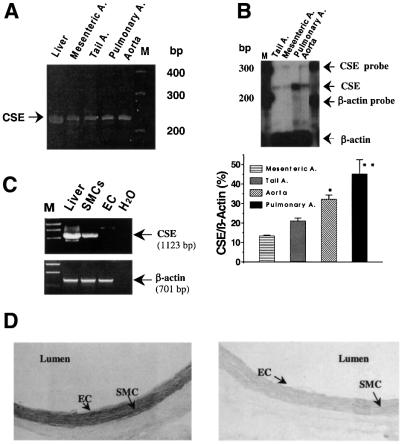
Fig. 6. Differential expression of CSE in rat vascular tissues. (A) RT–PCR analysis of the expression of CSE (234 bp) in rat liver, mesenteric artery, tail artery, pulmonary artery and aorta. (B) Quantitative comparison of CSE mRNA levels in rat tail artery, mesenteric artery, pulmonary artery and aorta with RPA. This is representative of three experiments. *P < 0.05 compared with mesenteric artery; **P < 0.01 compared with tail artery, mesenteric artery and aorta. A, artery. (C) The transcriptional expressions of CSE and β-actin in cultured SMCs and EC (endothelial cell) detected by RT–PCR. (D) In situ hybridization showing the location of CSE mRNA in rat aorta wall by antisense probe on the left and sense probe as control on the right.

An official website of the United States government
Here's how you know
Official websites use .gov
A
.gov website belongs to an official
government organization in the United States.
Secure .gov websites use HTTPS
A lock (
) or https:// means you've safely
connected to the .gov website. Share sensitive
information only on official, secure websites.
