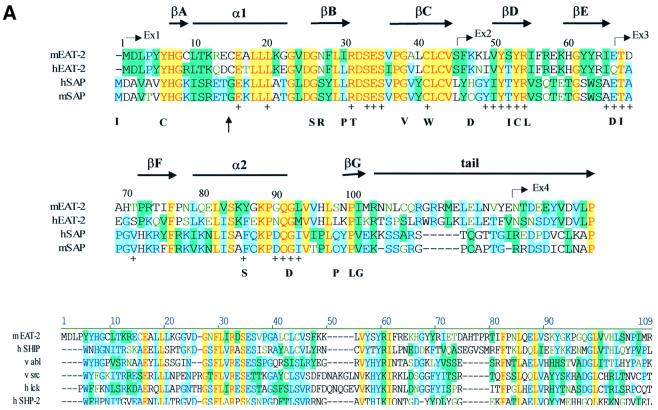
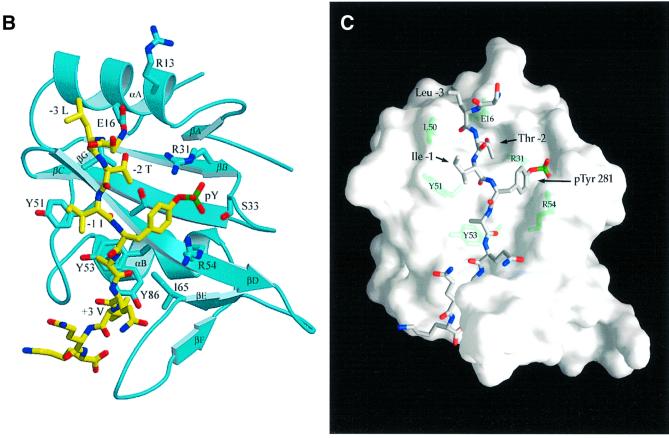
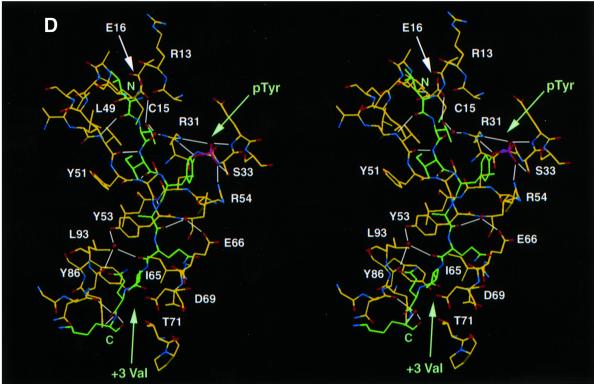
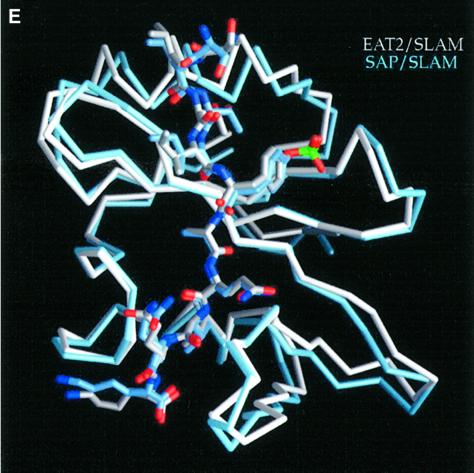
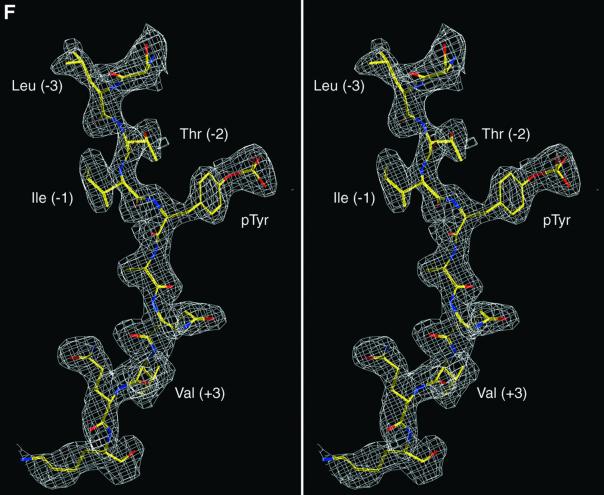
Fig. 3. Structure of mouse EAT-2–CD150 phosphopeptide complex. (A) Structure-based sequence comparison of EAT-2 with other SH2 domains. Upper panel: the human and mouse EAT-2 and SH2D1A protein sequences are compared. Yellow areas, identical residues; green areas, blocks of similarity; blue areas, conserved positions. Exon boundaries are indicated (Ex, exon). Elements of secondary structure are indicated at the top and labeled using the standard SH2 domain nomeclature (Eck et al., 1993). Key residues for the peptide–SH2 domain interactions are indicated by the symbol ‘+’. Amino acid substitutions found in XLP patients are indicated at the bottom. An arrow indicates Cys15 of EAT-2 and Gly16 of SH2D1A. Lower panel: the mouse EAT-2 SH2 domain is compared with the SH2 domain of the human inositol polyphosphate-5-phosphatase (h SHIP), viral Abelson leukemia oncogene (v abl), Rous sarcoma virus oncogene (v src), human tyrosine kinase lck (h lck) and human tyrosine phosphatase SHP-2 (h SHP-2). Blocks of color indicate similarity or identity as indicated in the above panel. (B) Ribbon diagram showing the EAT-2 SH2 domain in complex with the CD150 phosphopeptide. The bound phosphopeptide is shown in a stick representation (yellow). Selected EAT-2 residues that form the binding site are shown in blue. The N-terminal residues of the peptide make a parallel β-sheet interaction with strand βD; the side chains of these residues make hydrophobic contacts with Leu49 and Tyr51 in strand βD (see text, and D). Interestingly, R12 (at position αA2), which is conserved in most SH2 domains and generally contributes to phosphotyrosine coordination, does not participate in phosphate binding in the EAT-2 complex. Instead, Arg54 (βD6) hydrogen-bonds with the phosphate group. Similar coordination was described for the SH2D1A SH2 domain–CD150 phosphotyrosine peptide complex (Poy et al., 1999). Interactions C-terminal to the phosphotyrosine are dominated by Val +3pY, which binds in a hydrophobic cleft. (C) Surface representation of the EAT-2 SH2 domain with the bound CD150 pTyr281 peptide. Hydrophobic residues at the –1 and –3 positions of the peptide (in a stick representation) intercalate with hydrophobic and aromatic residues on the surface of the SH2 domain. Thr2 (Thr 279 of SLAM) hydrogen-bonds with Glu16. C-terminal to the phosphotyrosine, Val +3 is buried in a mostly hydrophobic groove. Key residues for the SH2 domain–peptide interaction are represented in light green. (D) Stereo view showing the details of CD150 coordination. Residues 278–286 of the CD150 phosphopeptide are shown in green; EAT-2 residues surrounding the bound peptide are colored yellow. White lines indicate hydrogen bond interactions; red spheres represent ordered water molecules that bridge between the peptide and the SH2 domain. EAT-2 residues are labeled in white; N and C indicate the respective termini of the CD150 peptide. Green arrows indicate the phosphotyrosine and ‘+3’ binding pockets. Note the β-sheet hydrogen bonding pattern between the main chain of residues 49–53 of EAT-2 and the N-terminal residues of the CD150 phosphopeptide. The peptide essentially forms an additional strand in the central β-sheet of EAT-2. (E) Superimposition of the mouse EAT-2 and human SH2D1A structures bound to the CD150 pTyr281 peptide. Mouse EAT-2 (gray) and human SH2D1A (blue) α-carbon traces are superimposed. Note that the peptides are bound in essentially identical conformations. (F) Stereo view of the electron density map for the CD150 phosphopeptide bound to the EAT-2 SH2 domain. The 2Fo – Fc annealed omit map was calculated at 2.15 Å resolution and contoured at 1.2σ.

An official website of the United States government
Here's how you know
Official websites use .gov
A
.gov website belongs to an official
government organization in the United States.
Secure .gov websites use HTTPS
A lock (
) or https:// means you've safely
connected to the .gov website. Share sensitive
information only on official, secure websites.
