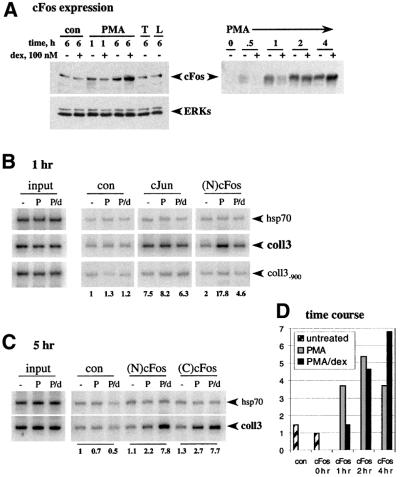
Fig. 1. Occupancy of the coll3 AP-1 element by cFos and cJun in vivo. (A) Effect of GR on PMA induction of cFos expression. U2OS.G cells were untreated (con), or treated with PMA, TNF (T) or LPS (L), in the presence or absence of dex, for 1 or 6 h, as indicated, and cFos expression in whole cell extracts was examined by immunoblotting with N-terminal cFos [(N)cFos] polyclonal antibodies (left, upper panel). Equal loading into each lane was verified by blotting with anti-ERK polyclonal antibodies (left, lower panel). cFos expression in U2OS.G cells treated with PMA in the presence or absence of dex for the time indicated was assessed by blotting with C-terminal cFos [(C)cFos] rabbit polyclonal antibodies (right panel). (B and C) Composition of AP-1 subunits within activation and repression complexes at col3A. U2OS.G cells were untreated (–) or cultured in the presence of PMA (P) or PMA+dex (P/d) for 1 (B) or 5 (C) h and chromatin immunoprecipitations were performed with control rabbit serum (con), cJun, (N)cFos and (C)cFos rabbit polyclonal antibodies. In each case, a +153/+423 fragment of hsp70 gene, and the –150/+68 (coll3) and –1179/–897 (coll3–900) fragments of collagenase-3 gene were PCR amplified. Equal amounts of total genomic DNA (input) were used for immunoprecipitations in each treatment condition. 32P incorporation into the coll3 product was quantified on a Storm 860 PhosphorImager and normalized to the signal obtained with control rabbit serum in untreated cells (shown below the gel). (D) Dynamics of cFos recruitment to col3A under conditions of PMA induction and dex repression. U2OS.G cells were untreated, or exposed to PMA or PMA+dex for the times indicated and chromatin immunoprecipitations were performed with control rabbit serum (con) or (N)cFos antibody. coll3 and hsp70 sequences were PCR amplified, quantified and expressed as a coll3:hsp70 ratio. The ratio obtained with (N)cFos antibody in untreated cells was arbitrarily set as 1.

An official website of the United States government
Here's how you know
Official websites use .gov
A
.gov website belongs to an official
government organization in the United States.
Secure .gov websites use HTTPS
A lock (
) or https:// means you've safely
connected to the .gov website. Share sensitive
information only on official, secure websites.
