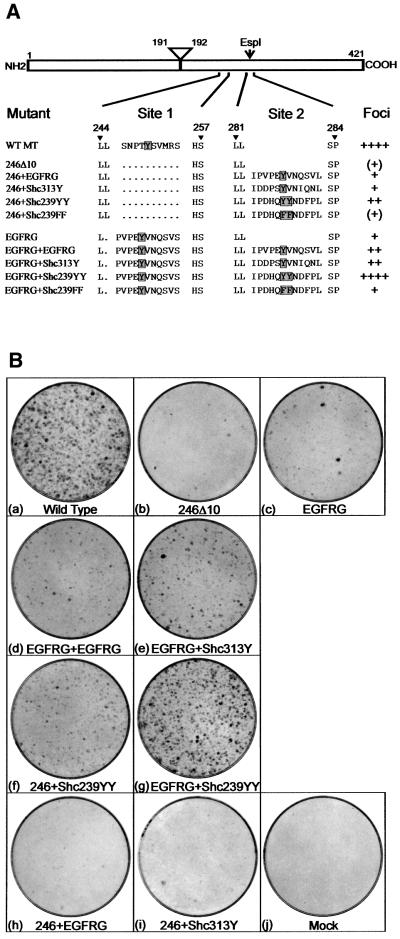
Fig. 1. (A) Sequences of mutations made to the 240–260 (site 1) and 282 (site 2) regions of MT. MT is represented schematically at the top, with the amino acid positions of the N- and C-terminal ends marked together with the locations of the intron removed to create the MT unique region and the EspI restriction site used to insert DNA sequences into site 2. Below, the amino acid sequences of the region between residues 244 and 257 and 281–284 are shown for wild-type MT and various mutants. A dot represents a deleted amino acid. The designation of each mutant is shown on the left. The position of the target phosphorylated tyrosine is shown by a shaded box. The amount of foci induced by each mutant plasmid after transfection into rat fibroblasts is indicated on the right. ++++ represents the amount of foci induced by similar amounts of wild-type MT DNA. (B) Foci induction by MT mutants. Plasmids containing each of the MT mutations were transfected by the calcium phosphate precipitation method into Rat2 fibroblasts. After 14 days, the medium was removed and the foci stained with Leishmann’s reagent. The MT mutant used is indicated beneath each dish. Dishes shown are representative of the results obtained in over 10 different experiments.

An official website of the United States government
Here's how you know
Official websites use .gov
A
.gov website belongs to an official
government organization in the United States.
Secure .gov websites use HTTPS
A lock (
) or https:// means you've safely
connected to the .gov website. Share sensitive
information only on official, secure websites.
