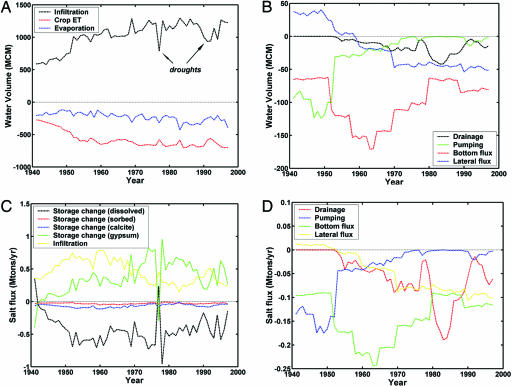
Fig. 2.
Simulated water and salt fluxes. (A and B) Annual-averaged water fluxes for the western San Joaquin Valley [million m3 (MCM) divide by 1,372 million m2 (after 1970) to describe fluxes in m/yr; i.e., 1,000 MCM/yr corresponds to 72.8 cm/yr]. (C and D) Salt balance (Mton/yr) for the western San Joaquin Valley. Positive fluxes designate incoming salt, whereas positive storage terms reflect a decrease in storage. Salt import by infiltration is controlled by ion concentrations of rainfall, surface water, and pumped groundwater. Drainage, bottom flux through Corcoran clay, and lateral salt fluxes toward the San Joaquin Valley trough were generally negative, indicating an export of salts. A major source of dissolved salt was due to gypsum dissolution (green). Respective maxima in 1977 were caused by reduced surface water applications during the drought. The temporary increase in salt export by drainage in the early 1980s was a result of the operation of the Westlands water district drainage system, which was permanently closed down in 1986.

