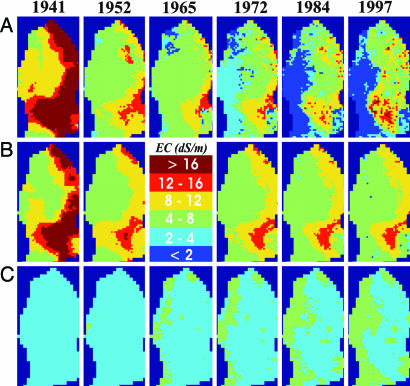
Fig. 3.
Temporal changes in the spatial distribution of dissolved salts, expressed by the electrical conductivity (EC, dS/m) of the average RZ (0–2 m below the land surface) (A), the shallow groundwater system (SGW; 6 m below the land surface) (B), and the deep groundwater system (DGW; 20–40 m below the land surface) (C). Clearly shown is the initially high RZ salinity in the Panoche-Cantua interfan area (southwestern portion of the study area) and the uniformly low salinity in the DGW. After 10 years of irrigation (1952), part of the initial salinity was leached, resulting in a decrease in RZ salinity. Some of the initial salinity was still present in the SGW. The DGW system on the other hand remained low in salinity. Leaching of RZ salts continued in the initial simulation period, with a sudden decrease in RZ salinity after switching from groundwater to surface water for irrigation in the 1960s. As water levels started to rise in the eastern part of the study area during the 1970s and 1980s, RZ salinity levels increased again due to the simulated increase in irrigation efficiency and capillary rise followed by evaporation as water tables became shallower. This trend of increasing salinity continued through the 1990s. The higher soil salinity in Broadview water district (northern area) was higher than the surrounding areas due to recycling of saline drainage water there.

