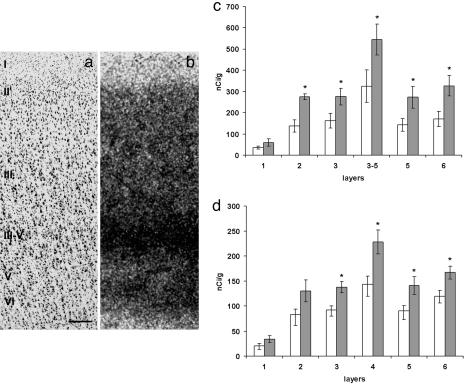
Fig. 2.
gabaAα5 expression in the human AnCg and DLPFC. (a and b) Paired photomicrographs from AnCg. (a) Nissl staining of a perpendicular section from a control subject showing the AnCg cytoarchitecture. (b) Film autoradiogram from an adjacent section hybridized with GABAAα5 probe. Shown are histograms showing the distribution patterns of GABAAα5 mRNA in different layers of AnCg (c) and DLPFC (d) in control subjects (n = 5; white columns) and in bipolar patients (n = 5; gray columns). (Scale bar in a, 250 mm.)

