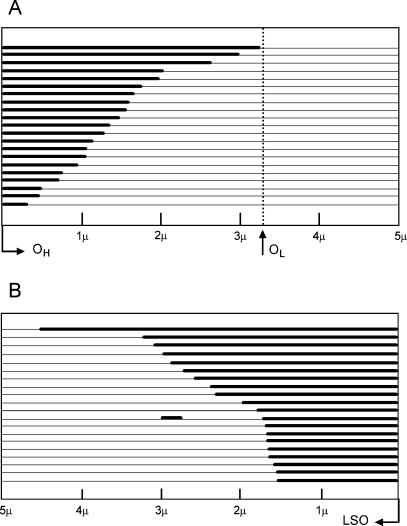
Figure 4.
Length distribution of newly synthesized nascent-strand intermediates. Individual mtDNA molecules are shown in linear form. Thick lines represent new complementary strand synthesis, and parental strands are shown as thin lines. (A) The lengths of the newly synthesized heavy strands measured from Exp-D molecules. All Exp-D in this analysis occur within the boundaries of OH and OL. (B) The lengths of nascent L-strands measured from GpC molecules. The position of OH cannot be determined from the GpC forms and is therefore not shown. The L-strand origin (LSO) is displayed to the far right.

