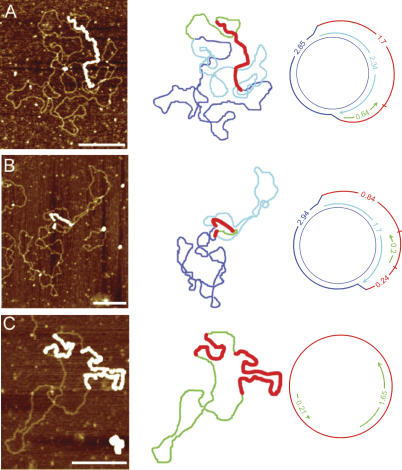
Figure 5.
Replicating mtDNA with alternate L-strand origins. The first column displays the AFM images, the second column outlines the contour, and the third column diagrams the intermediate and shows the strand contour lengths. Blue lines represent the parental strands, red lines represent the compacted ssDNA coated with SSB protein, aqua lines represent the nascent H-strand synthesis, and green lines represent nascent L-strand synthesis. Although the third column shows the molecules in one particular orientation relative to OH, the opposite orientation is also possible, with OH located at the other fork. Bars, 0.25 μm.

