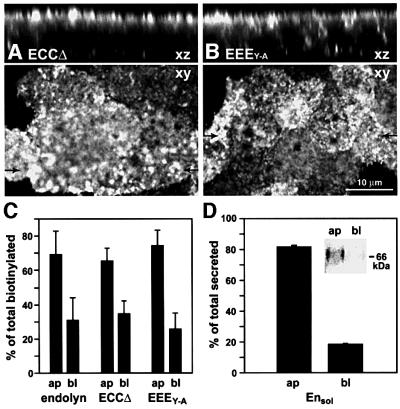
Fig. 8. Apical polarity of ECCΔ, EEEY–A and Ensol in stably transfected MDCK cells. (A and B) Steady-state distribution of ECCΔ and EEEY–A revealed by confocal microscopy. Upper panels show side views (xz) of cells at the positions indicated by arrows in the lower panels, which depict xy views of the apical surface. (C) Surface biotinylation of cells expressing endolyn, ECCΔ or EEEY–A. Biotinylated fractions were determined as described in Figure 1 (mean ± SD from four experiments). (D) Cells expressing Ensol were metabolically labeled for 4 h and secreted Ensol was immuno precipitated from the medium. The average percent apical and basolateral secretion of total (± range) from two experiments is plotted; a representative sample pair is shown inset.

An official website of the United States government
Here's how you know
Official websites use .gov
A
.gov website belongs to an official
government organization in the United States.
Secure .gov websites use HTTPS
A lock (
) or https:// means you've safely
connected to the .gov website. Share sensitive
information only on official, secure websites.
