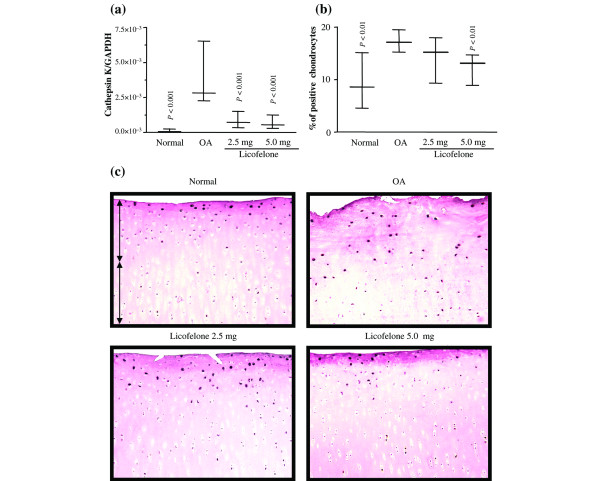
Figure 2.

Cathepsin K gene expression and protein synthesis. (a) mRNA levels, as determined by real-time quantitative PCR analysis as described in Materials and methods. (b) Morphometric analysis of cathepsin K immunostaining. (a, b) Data are expressed as median and range and are presented as box plots, where the boxes represent the 1st and 3rd quartiles, the line within the box represents the median, and the lines outside the box represent the spread of values. P-values were compared to the placebo group (OA) using the Mann-Whitney U test. (c) Representative cathepsin K immunohistochemical sections of tibial plateaus. Superficial (superfical and upper intermediate layers) and deep (lower intermediate and deep layers) zones of cartilage are indicated on the picture with arrows. No specific staining was detected in the OA cartilage with immunoabsorbed serum (data not shown) (original magnification × 250). GAPDH, glyceraldehyde-3-phosphate dehydrogenase.
