
Figure 2.
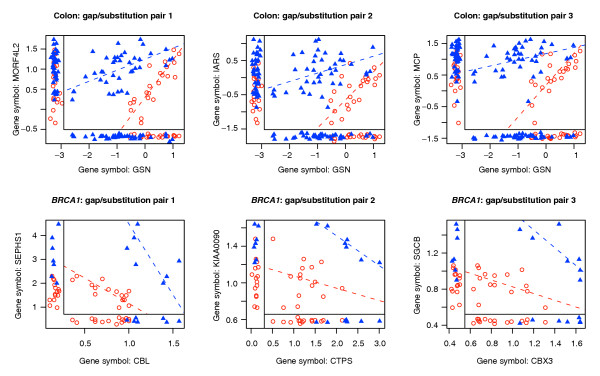
Six examples of joint differential gene expression of the gap/substitution type, obtained from the colon and BRCA1 datasets. The inner panels show the joint distribution; the outer margins display the univariate distributions. Blue triangles stand for cancers in colon and BRCA1 mutants in breast; the red circles stand for normal samples in colon and sporadic cancers in breast. The dashed lines represent the conditional first principal components.