
Figure 6.
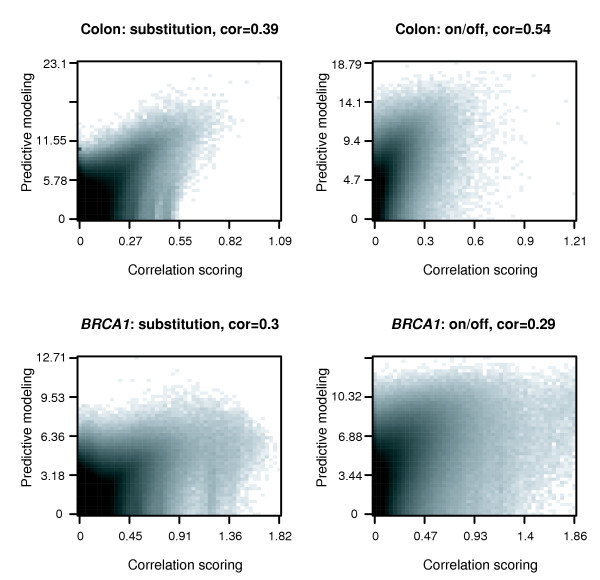
Comparison of CorScor and predictive modeling scores. Density plots for a comparison of the gap/substitution scoring function from correlation scoring defined in Equation (1) and predictive modeling (Equation (4)), as well as the on/off objective measures defined in Equations (2) and (5). Each panel is divided into a 50-×-50-cell grid. The darker the color of a cell, the more instances are therein. In the figure header, cor is the Pearson correlation coefficient between the CorScor and the respective predictive modeling scores.