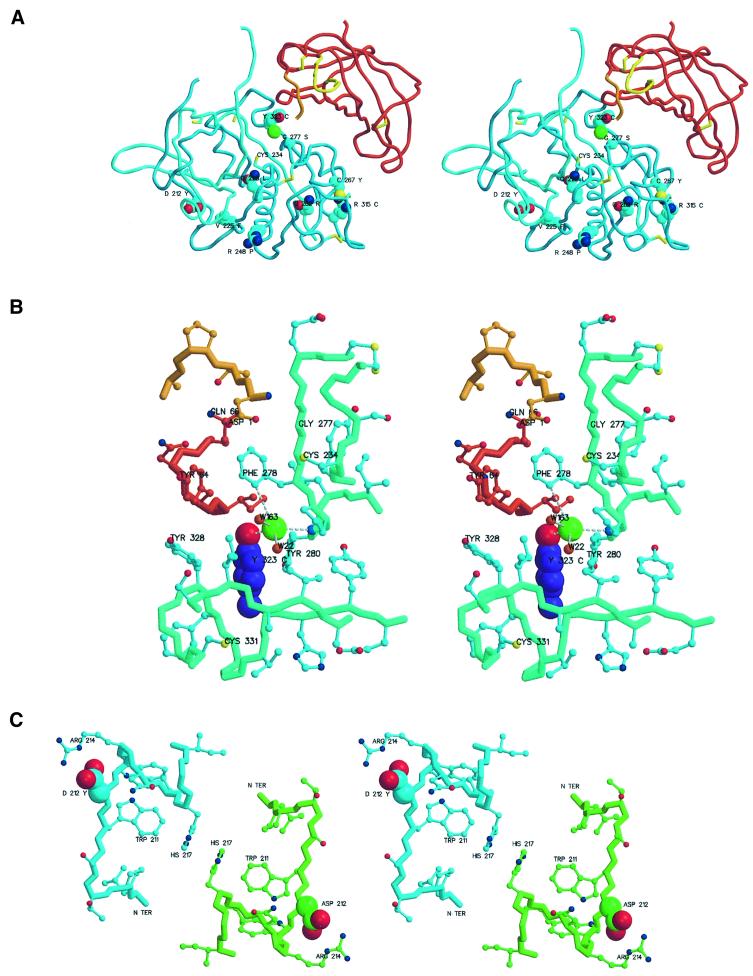
Fig. 6. Regions with missense mutations resulting in genetic diseases. The figures were prepared with MAIN (Turk, 1992) and rendered with RENDER (Merritt and Bacon, 1997). (A) Overview of missense mutations. The chain trace of the DPPI domain is shown in the colors used in Figure 1. Side chains of mutated residues are shown as cyan, red and dark blue balls representing carbon, oxygen and nitrogen atoms, respectively. All cysteine residues are shown as sticks. Mutated residues are marked with their sequence IDs and residue names in one-letter code. The catalytic cysteine is also marked. (B) Y323C mutant with chloride ion coordination. A side view towards the S2 binding pocket containing the chloride ion and its coordination with the active site residues Asp1 and Cys234 at the top. The color scheme is as in (A). The exceptions are the side chain atoms of Tyr323, shown as balls with carbon atoms colored purple, and the papain-like domains residues of the main and side chain trace, which are shown in greenish and cyan, respectively. The main chain bonds are thicker. Oxygens of the main chain carbonyls are omitted for clarity. The chloride ion is a large green ball, and the small red balls adjacent to it are solvent molecules. Chloride coordination is shown with white disconnected sticks. Relevant residues are marked with their sequence IDs and residue names. (C) D212Y mutant: view along a molecular 2-fold axis. Carbon atoms and covalent bonds of chain trace and side chains are differentiated by color: cyan for the left and green for the right molecule. Asp212 side chain atoms are highlighted as larger balls.

An official website of the United States government
Here's how you know
Official websites use .gov
A
.gov website belongs to an official
government organization in the United States.
Secure .gov websites use HTTPS
A lock (
) or https:// means you've safely
connected to the .gov website. Share sensitive
information only on official, secure websites.
