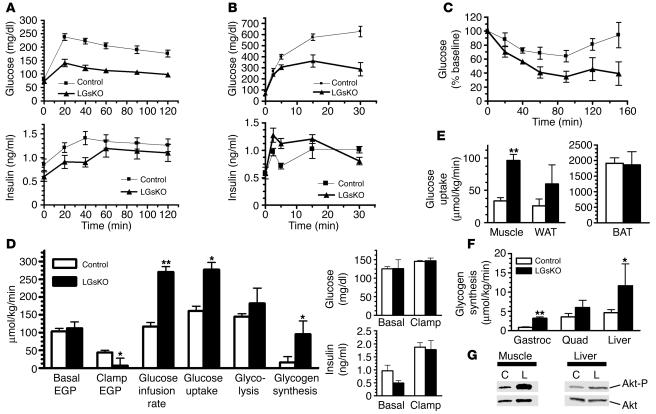
Figure 4.
Glucose tolerance, insulin sensitivity, and secretion. (A) Blood glucose (top) and serum insulin (bottom) was measured at indicated time points before and after i.p. glucose administration (2 mg/g body weight) in overnight-fasted LGsKO (filled triangles) and control (filled squares) mice (n = 13–15/group). (B) Short-term glucose tolerance test using 3 mg/g glucose (n = 6/group). (C) Blood glucose was measured before and after i.p. insulin administration (n = 3/group). (D) Whole-body glucose fluxes in LGsKO and control mice during euglycemic-hyperinsulinemic clamp studies (n = 3–7/group). EGP, endogenous glucose production. Basal and clamp glucose and insulin levels are shown on the right. (E) Tissue glucose uptake rates during clamp studies. (F) Glycogen synthesis rates in gastrocnemius (Gastroc) and quadriceps (Quad) muscles and liver during clamp studies. (G) Immunoblot of muscle (left) and liver (right) extracts from control and LGsKO mouse with anti–phospho-Akt1 (top) and anti-Akt Abs (bottom). *P < 0.05; **P < 0.01.

