Figure 2.
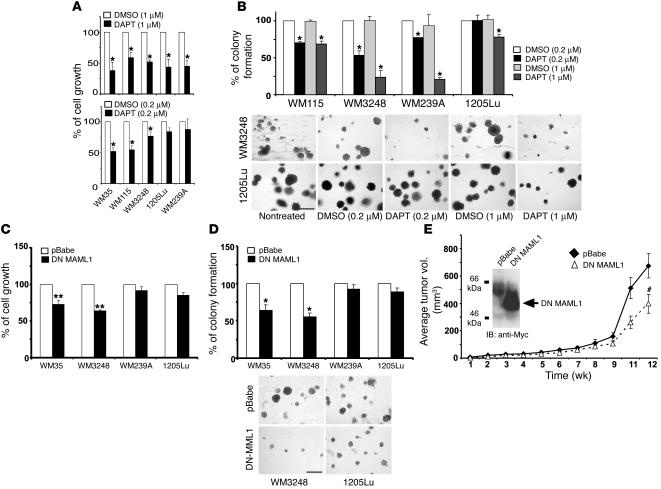
Suppression of Notch signaling inhibits melanoma cell growth. (A) Cells were treated with DAPT (0.2 μM and 1 μM) and compared with equal volume of solvent DMSO. Cell growth was analyzed by MTT. Results indicate percentage of cell growth compared with controls (adjusted to 100%). *P < 0.005, Student’s t test. (B) Colonies formed in soft agar were counted and photographed after 10 days incubation. Graphs and representative photographs from each condition are shown. Scale bar: 500 μm. Results are mean ± SD of 3 independent experiments. (C) Growth of cells transfected with DN MAML1/pBabe was analyzed by MTT. Results are mean ± SD of 3 independent experiments. **P < 0.001, Student’s t test. (D) Number of colonies of cells transfected with DN MAML1/pBabe or pBabe (mock). Results are mean ± SD of 3 independent experiments. Representative photos are shown. Scale bar: 500 μm. (E) Effect of DN MAML1 on WM3248 cell growth was assessed in SCID mice. Tumor size was measured at indicated times after subcutaneous injection. Results are mean ± SD (n = 8). #P = 0.024, Student’s t test. Inner panel, WM3248 cells were transfected with DN MAML1/pBabe or pBabe. Immunoblots confirmed Myc-tagged DN MAML1 expression.

