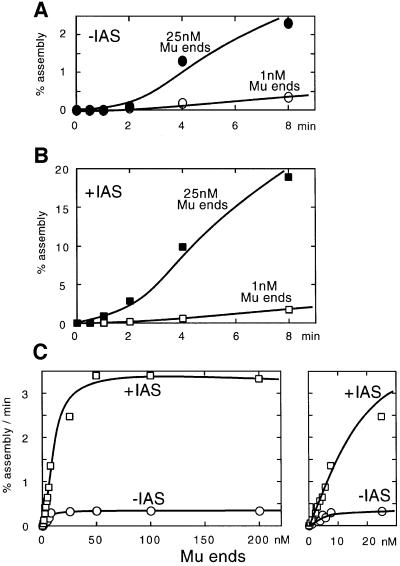
Fig. 3. Mu end concentration dependency of transpososome assembly kinetics with or without the IAS. The assembly reactions were carried out as described in Figure 2, except the concentration of Mu end DNA was varied from 0.1 to 200 nM each of the L- and R-ends. Since higher concentrations of the Mu end fragments require elevated MuA concentrations, the optimal MuA concentration was determined for each Mu end concentration. The optimal IAS, IHF and HU concentrations were also determined for each Mu end concentration. For the concentration range of each Mu end fragment from 0.1 to 5 nM, 200 nM MuA, 50 nM the IAS, 150 nM IHF, 200 nM HU and 2.5 µg/ml heparin were added; for 50 and 100 nM each Mu end fragment, 900 nM MuA, 200 nM IAS, 250 nM IHF, 200 nM HU and 3.5 µg/ml heparin were added; and for 200 nM Mu ends, 1800 nM MuA, 300 nM IAS, 350 nM IHF, 200 nM HU and 3.5 µg/ml heparin were added. For reactions in the absence of the IAS, a control DNA fragment was included at the same concentration as for the IAS. The reactions were incubated at 30°C for the times indicated. Only the L-end was labeled with 32P. (A) Time course of assembly in the absence of the IAS. The ordinate is expressed as the percentage of the labeled Mu L-end fragment converted to the CDC containing both L- and R-end fragments. (B) Time course of assembly in the presence of the IAS. (C) Mu end concentration dependency of the assembly rate in the presence or absence of the IAS. The right panel shows an expansion of the lower concentration area.

An official website of the United States government
Here's how you know
Official websites use .gov
A
.gov website belongs to an official
government organization in the United States.
Secure .gov websites use HTTPS
A lock (
) or https:// means you've safely
connected to the .gov website. Share sensitive
information only on official, secure websites.
