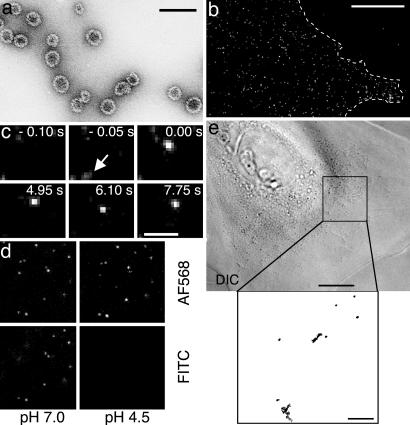
Fig. 1.
SPT of Py VLPs on the bottom surface of live 3T6 cells. (a) Electron micrograph of VLPs visualized by negative staining. (Scale bar, 0.1 μm.) (b) Epi-fluorescence micrograph of AF568-labeled VLPs bound to a live 3T6 cell (Scale bar, 10 μm.) (c) TIRF microscopy images from a time series (20 Hz, 1,000 frames) showing a single AF568-labeled VLP binding to a 3T6 cell. The arrow points to the blurred particle fluorescence detected one frame before binding. (Scale bar, 1 μm.) (d) TIRF microscopy images of VLPs colabeled with FITC and AF568 and bound to the bottom surface of live 3T6 cells 45 min after VLP addition to the coverslip. The cells are in a medium at either pH 7.0 (Left) or pH 4.5 (Right). Note that the FITC emission spectrum shifts upon acidification, rendering the FITC fluorescence of acid-exposed VLPs undetectable. (e)(Left) Differential interference contrast (DIC) image of the cell shown in d acquired after acidification of the medium. (Scale bar, 10 μm.) (Right) The trajectories (20 Hz, 1,000 frames) of surface-bound VLPs were acquired by detecting AF568 before acidification. (Scale bar, 2 μm.)

