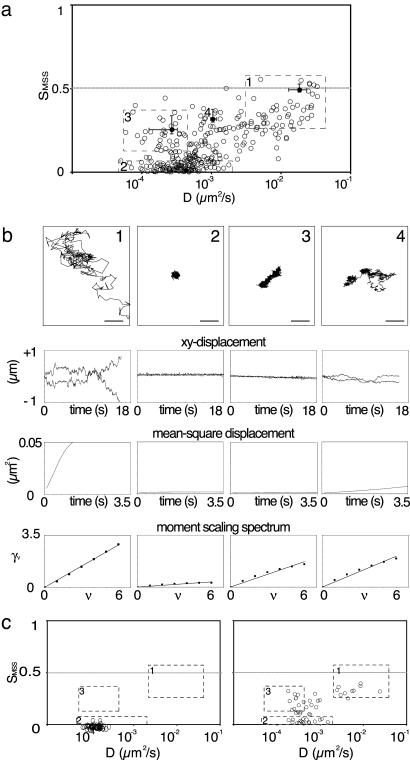
Fig. 2.
Analysis of VLP trajectories from live cells. (a) Scatter plot of the diffusion coefficient versus the slope of the MSS (D/SMSS) of VLP trajectories at the bottom surface of live cells. All harvested trajectories are plotted irrespective of the recorded length and whether the particles were bound or free at the start of the recording. Every point represents one trajectory and every trajectory is at least 100 steps (5 s) long. The longest trajectories are 2,000 steps (100 s) long. The three boxes highlight regions on the graph in which VLP motion is either rapid and random (box 1), confined (box 2), or confined with a slow drift (box 3). (b) Representative trajectories (numbered 1, 2, and 3) from each of the three boxes and one typical outlier (trajectory 4). The trajectories represent rapid and random movement (trajectory 1), confinement (trajectory 2) and confinement with a slow drift (trajectory 3). Trajectory 4 represents a VLP that changes its mode of motion during the acquisition time. Below each of these trajectories are the respective analytical plots: absolute displacement in μm for x and y direction versus time, MSD, and MSS. (c) D/SMSS scatter plot of trajectories from control experiments performed with VLPs bound to glass coverslips (Left) or to the top surface of cells (Right).

