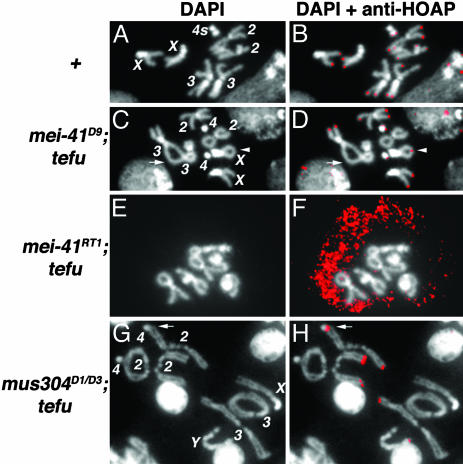
Fig. 3.
HOAP localization in various mutants. The genotypes are given to the left. (A, C, E, and G) DAPI-stained mitotic nuclei with chromosomes labeled except for E. (B, D, F, and H) Merged views of DAPI and anti-HOAP antibody staining (red). In C and D, the arrow indicates a 3–3 double fusion with no HOAP signal. The arrowhead indicates an X sister fusion with a HOAP signal at the junction. In F, the antibody signals are overexposed to indicate the lack of any telomeric signals. In G and H, the arrow indicates a 2–4 double fusion with HOAP signals at the junctions.

